Hi. So I installed MangoHud (i.e. MSI Afterburner for Ubuntu).
I tried building it and installing it under "Source", and "GitHub releases" sections.
Every time, it said MangoHud installed.
But I can't find it, and therefore, I can't open or run it.
It's not in /usr/share/applications.
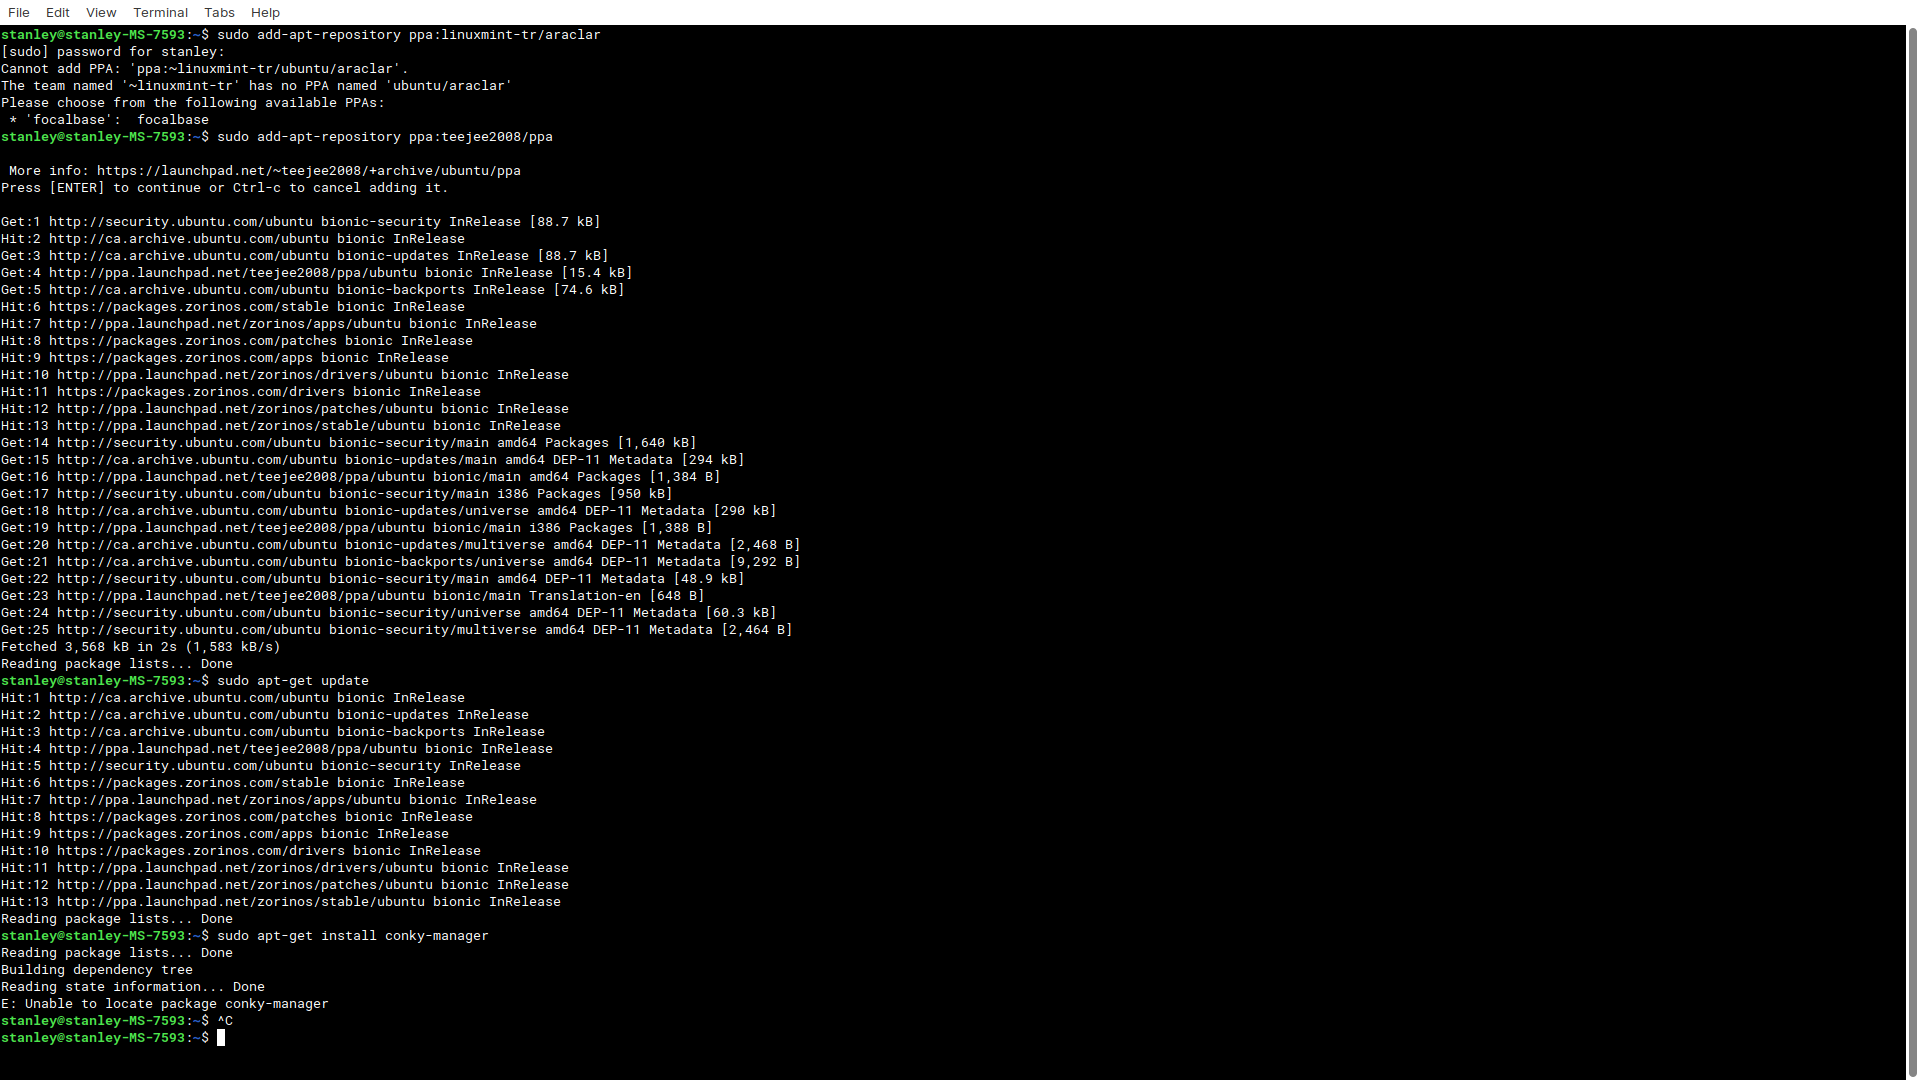
P.S. Was I supposed to read all the text in Terminal?
I didn't because I tried restarting my pc, but I still can't find it.
I tried this:
And this:
aticonfig --odgc --odgt
Still nothing.
I wanna see GPU CPU RAM VRAM and disk usage and temps all the time
(it can be from a different app(s)).
Because I don't know why Kdenlive video editor is lagging at low CPU usage.
Also, I want to see PC specs after an app crashes, and just in general.
You can open Software & Updates from your app menu, then move to the "Other software" tab. Remove the TeeJee2008 repo for conky-manager; it does not work.
Thanks. But I just realized conky only shows disk space available.
Is there a way to show disk read/write/whatever speeds in % or MB/s? (sorry if I was unclear b4).
And also GPU usage (ideally in %)?
The Nvidia thing doesn't work (probably since my GPU's a Radeon).
Windows had both, afaik.
(I think disk speed was always at 100% in Windows 10 on my old laptop).
Yes, as I said, we can custom make a conky for your needs.
Let me spend a few minutes making one- Please post Everything you want on it in One List following this post.
When you open Conky Manager; There is an icon on the toolbar for Settings. This is your positioning settings (It will automatically change the positioning in the conky file for you). I will set the conky position to Middle-middle 0,0 - Then you can adjust the position as you need. If you run the conky and it does not appear; change the position until it does. Sometimes, they run off screen...
RAM usage, and not free RAM available (either GB or % is fine)
CPU usage as %, for each core and thread if possible.
graphs like in Psensor. That way, if an app crashes or lags while I'm not paying attention to Conky, I can see: oh, CPU was at 100% when that happened. Or Disk was trying to read/write at 100%.
option to turn off/on any (in case there's too many)
If possible, have it as a transparent overlay on top of everything and I can click through it. (with outline around the letters, since that's easiest to read on any similar-colour backgrounds afaik).
Given the amount of monitoring you want in one conky - this thing will be huge if it includes graphs. And by huge, I mean impossible.
However, I can make Progress Bar style graphs.
in addition, the TeejEe Conky's that come with Conky-all install include Large Graphs. If you are like me, you may run several conky's at once.
In the meantime, let me see what I can make and if it meets your needs.
I will post it here as a text you can copy and paste into a new textfile- then just save it as a unique name so you can easily identify it in your Conky Manager.
Edit: Can it also list top few apps using most CPU/RAM, and also show total CPU/RAM usage as % please?
(I noticed Conky doesn't show total CPU/RAM usage when listing top 5 apps).
What do you mean by progress bar style graphs?
Edit: I was thinking a bunch of graphs stacked on top of each other, like in Psensor. But if you can't do that or it's too much work, don't worry about it.
I cannot make it so you can Turn On or Off functions of the conky- it follows a singular script. For this, you would need more than one conky.
What color should text be? Do you use Light wallpapers? Dark wallpapers?
You can also put a background image in the conky, to keep it consistently visible, no matter what wallpaper you use.
Is this going on a Notebook or tower PC?
Thanks! I was able to edit an existing code and paste in yours.
I'm a bit confused tho:
At the bottom where it says [ 0B k/s ] up and down, is this the internet upload and download speeds? Because they're always 0, even while downloading a file.
is disk IO the read/write speed? I just want to make sure because it says B or KiB, and not B/s or KiB/s. I'm not familiar with disk IO terminology.
were you able to add in GPU usage?
Also, I noticed that RAM usage in ZorinOS Lite Task manager is quite different from RAM usage in both Psensor and your Conky code. Why is this?
e.g. Task Manager says 2.2 GiB/5.8 GiB used
your code says 5.67 Gib/5.8GB used ie 98% used,
Psensor says 2% Ram available (so, same as Conky)
Also, is there a website with a list of indicators that I can try adding to the code you wrote?
You can use ifconfig in terminal to determine your Net ID. I set the conky to mine, in order to ensure everything worked.
So, the file you have should say wlp2s0; you will need to change that to yours. If you are using Wifi or Cat5; use your identifier.
I/O is Input Output.
You would need to know Your Specific Graphics card - Nvidia or integrated.
I will paste a line for Nvidia here that perhaps you can adjust as needed:
in terminal to open the manual for conky to find the line arguments.
I use the commands $memperc% and $/mem/memmax followed with a breakdown of memory usage per application as I find it to be more accurate. Others may use memutils, instead.