Unable to understand Smart Scan report

I ran smartctl - a /dev/sda2 to see my disk health. I have suspicion that my drive is failing because of filesystem errors multiple times recently.
Here's the output -

jayesh@Jayesh-IdeaPad:~$ sudo smartctl -a /dev/sda2
smartctl 7.1 2019-12-30 r5022 [x86_64-linux-5.15.0-70-generic] (local build)
Copyright (C) 2002-19, Bruce Allen, Christian Franke, www.smartmontools.org

=== START OF INFORMATION SECTION ===
Device Model:     TOSHIBA MQ04ABF100
Serial Number:    11A1PWYKT
LU WWN Device Id: 5 000039 a82182661
Firmware Version: JU0A0E
User Capacity:    1,000,204,886,016 bytes [1.00 TB]
Sector Sizes:     512 bytes logical, 4096 bytes physical
Rotation Rate:    5400 rpm
Form Factor:      2.5 inches
Device is:        Not in smartctl database [for details use: -P showall]
ATA Version is:   ACS-3 T13/2161-D revision 5
SATA Version is:  SATA 3.3, 6.0 Gb/s (current: 6.0 Gb/s)
Local Time is:    Wed Jun 28 17:14:13 2023 IST
SMART support is: Available - device has SMART capability.
SMART support is: Enabled

=== START OF READ SMART DATA SECTION ===
SMART overall-health self-assessment test result: PASSED

General SMART Values:
Offline data collection status:  (0x85)	Offline data collection activity
					was aborted by an interrupting command from host.
					Auto Offline Data Collection: Enabled.
Self-test execution status:      (   0)	The previous self-test routine completed
					without error or no self-test has ever 
					been run.
Total time to complete Offline 
data collection: 		(  120) seconds.
Offline data collection
capabilities: 			 (0x5b) SMART execute Offline immediate.
					Auto Offline data collection on/off support.
					Suspend Offline collection upon new
					command.
					Offline surface scan supported.
					Self-test supported.
					No Conveyance Self-test supported.
					Selective Self-test supported.
SMART capabilities:            (0x0003)	Saves SMART data before entering
					power-saving mode.
					Supports SMART auto save timer.
Error logging capability:        (0x01)	Error logging supported.
					General Purpose Logging supported.
Short self-test routine 
recommended polling time: 	 (   2) minutes.
Extended self-test routine
recommended polling time: 	 ( 170) minutes.
SCT capabilities: 	       (0x003d)	SCT Status supported.
					SCT Error Recovery Control supported.
					SCT Feature Control supported.
					SCT Data Table supported.

SMART Attributes Data Structure revision number: 16
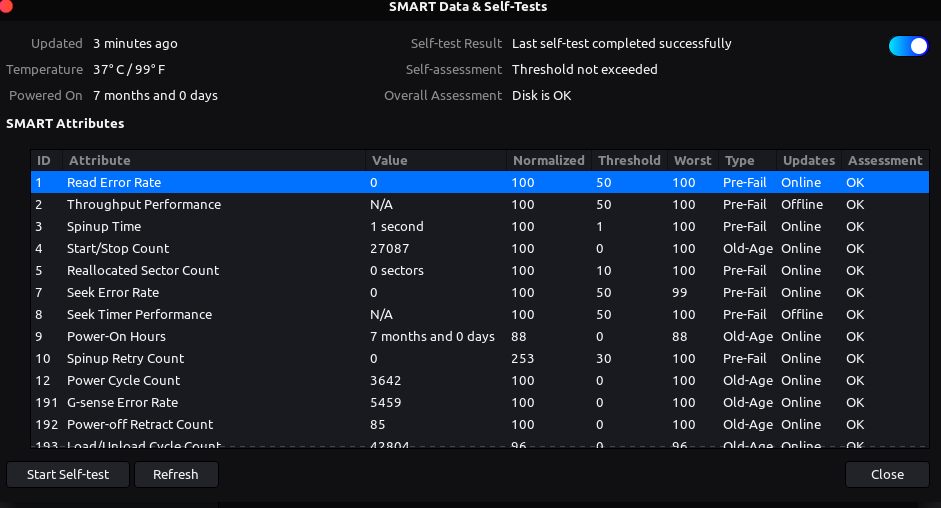
Vendor Specific SMART Attributes with Thresholds:
ID# ATTRIBUTE_NAME          FLAG     VALUE WORST THRESH TYPE      UPDATED  WHEN_FAILED RAW_VALUE
  1 Raw_Read_Error_Rate     0x000b   100   100   050    Pre-fail  Always       -       0
  2 Throughput_Performance  0x0005   100   100   050    Pre-fail  Offline      -       0
  3 Spin_Up_Time            0x0027   100   100   001    Pre-fail  Always       -       1305
  4 Start_Stop_Count        0x0032   100   100   000    Old_age   Always       -       27087
  5 Reallocated_Sector_Ct   0x0033   100   100   010    Pre-fail  Always       -       0
  7 Seek_Error_Rate         0x000b   100   099   050    Pre-fail  Always       -       0
  8 Seek_Time_Performance   0x0005   100   100   050    Pre-fail  Offline      -       0
  9 Power_On_Hours          0x0032   088   088   000    Old_age   Always       -       5126
 10 Spin_Retry_Count        0x0033   253   100   030    Pre-fail  Always       -       0
 12 Power_Cycle_Count       0x0032   100   100   000    Old_age   Always       -       3642
191 G-Sense_Error_Rate      0x0032   100   100   000    Old_age   Always       -       5456
192 Power-Off_Retract_Count 0x0032   100   100   000    Old_age   Always       -       85
193 Load_Cycle_Count        0x0032   096   096   000    Old_age   Always       -       42804
194 Temperature_Celsius     0x0022   100   100   000    Old_age   Always       -       40 (Min/Max 20/58)
196 Reallocated_Event_Count 0x0032   100   100   000    Old_age   Always       -       0
197 Current_Pending_Sector  0x0032   100   100   000    Old_age   Always       -       0
198 Offline_Uncorrectable   0x0030   100   100   000    Old_age   Offline      -       0
199 UDMA_CRC_Error_Count    0x0032   200   200   000    Old_age   Always       -       160
206 Flying_Height           0x0020   100   100   000    Old_age   Offline      -       16711
220 Disk_Shift              0x0002   100   100   000    Old_age   Always       -       0
222 Loaded_Hours            0x0032   088   088   000    Old_age   Always       -       4955
223 Load_Retry_Count        0x0032   100   100   000    Old_age   Always       -       0
224 Load_Friction           0x0022   100   100   000    Old_age   Always       -       0
226 Load-in_Time            0x0026   100   100   000    Old_age   Always       -       185
240 Head_Flying_Hours       0x0001   100   100   001    Pre-fail  Offline      -       0

SMART Error Log Version: 1
ATA Error Count: 163 (device log contains only the most recent five errors)
	CR = Command Register [HEX]
	FR = Features Register [HEX]
	SC = Sector Count Register [HEX]
	SN = Sector Number Register [HEX]
	CL = Cylinder Low Register [HEX]
	CH = Cylinder High Register [HEX]
	DH = Device/Head Register [HEX]
	DC = Device Command Register [HEX]
	ER = Error register [HEX]
	ST = Status register [HEX]
Powered_Up_Time is measured from power on, and printed as
DDd+hh:mm:SS.sss where DD=days, hh=hours, mm=minutes,
SS=sec, and sss=millisec. It "wraps" after 49.710 days.

Error 163 occurred at disk power-on lifetime: 4956 hours (206 days + 12 hours)
  When the command that caused the error occurred, the device was active or idle.

  After command completion occurred, registers were:
  ER ST SC SN CL CH DH
  -- -- -- -- -- -- --
  84 41 e0 27 30 15 40  Error: ICRC, ABRT at LBA = 0x00153027 = 1388583

  Commands leading to the command that caused the error were:
  CR FR SC SN CL CH DH DC   Powered_Up_Time  Command/Feature_Name
  -- -- -- -- -- -- -- --  ----------------  --------------------
  60 08 10 78 31 64 40 00      00:01:14.677  READ FPDMA QUEUED
  61 58 f0 68 8a d7 40 00      00:01:14.677  WRITE FPDMA QUEUED
  60 00 e8 00 24 5d 40 00      00:01:14.677  READ FPDMA QUEUED
  61 40 e0 e8 2f 15 40 00      00:01:14.677  WRITE FPDMA QUEUED
  ef 10 03 00 00 00 a0 00      00:01:14.677  SET FEATURES [Enable SATA feature]

Error 162 occurred at disk power-on lifetime: 4956 hours (206 days + 12 hours)
  When the command that caused the error occurred, the device was active or idle.

  After command completion occurred, registers were:
  ER ST SC SN CL CH DH
  -- -- -- -- -- -- --
  84 41 20 bf 8a d7 40  Error: ICRC, ABRT at LBA = 0x00d78abf = 14125759

  Commands leading to the command that caused the error were:
  CR FR SC SN CL CH DH DC   Powered_Up_Time  Command/Feature_Name
  -- -- -- -- -- -- -- --  ----------------  --------------------
  60 00 c8 00 23 5d 40 00      00:01:14.247  READ FPDMA QUEUED
  61 58 20 68 8a d7 40 00      00:01:14.247  WRITE FPDMA QUEUED
  61 58 08 00 98 d7 40 00      00:01:14.246  WRITE FPDMA QUEUED
  60 f8 00 00 31 64 40 00      00:01:14.244  READ FPDMA QUEUED
  60 00 b8 00 5f 63 40 00      00:01:14.243  READ FPDMA QUEUED

Error 161 occurred at disk power-on lifetime: 4955 hours (206 days + 11 hours)
  When the command that caused the error occurred, the device was active or idle.

  After command completion occurred, registers were:
  ER ST SC SN CL CH DH
  -- -- -- -- -- -- --
  84 41 10 b7 c6 16 40  Error: ICRC, ABRT at LBA = 0x0016c6b7 = 1492663

  Commands leading to the command that caused the error were:
  CR FR SC SN CL CH DH DC   Powered_Up_Time  Command/Feature_Name
  -- -- -- -- -- -- -- --  ----------------  --------------------
  61 08 10 b0 c6 16 40 00      00:22:34.223  WRITE FPDMA QUEUED
  ea 00 00 00 00 00 a0 00      00:22:34.191  FLUSH CACHE EXT
  61 88 00 28 c6 16 40 00      00:22:34.191  WRITE FPDMA QUEUED
  61 98 f8 00 54 80 40 00      00:22:34.190  WRITE FPDMA QUEUED
  ea 00 00 00 00 00 a0 00      00:22:32.578  FLUSH CACHE EXT

Error 160 occurred at disk power-on lifetime: 4955 hours (206 days + 11 hours)
  When the command that caused the error occurred, the device was active or idle.

  After command completion occurred, registers were:
  ER ST SC SN CL CH DH
  -- -- -- -- -- -- --
  84 41 20 77 28 83 40  Error: ICRC, ABRT at LBA = 0x00832877 = 8595575

  Commands leading to the command that caused the error were:
  CR FR SC SN CL CH DH DC   Powered_Up_Time  Command/Feature_Name
  -- -- -- -- -- -- -- --  ----------------  --------------------
  61 18 20 60 28 83 40 00      00:20:48.344  WRITE FPDMA QUEUED
  60 28 58 08 30 91 40 00      00:20:46.690  READ FPDMA QUEUED
  60 00 f0 08 2f 91 40 00      00:20:46.685  READ FPDMA QUEUED
  60 00 e8 d8 2d 91 40 00      00:20:46.660  READ FPDMA QUEUED
  ea 00 00 00 00 00 a0 00      00:20:46.568  FLUSH CACHE EXT

Error 159 occurred at disk power-on lifetime: 4955 hours (206 days + 11 hours)
  When the command that caused the error occurred, the device was active or idle.

  After command completion occurred, registers were:
  ER ST SC SN CL CH DH
  -- -- -- -- -- -- --
  84 41 38 1f 8a a7 40  Error: ICRC, ABRT at LBA = 0x00a78a1f = 10979871

  Commands leading to the command that caused the error were:
  CR FR SC SN CL CH DH DC   Powered_Up_Time  Command/Feature_Name
  -- -- -- -- -- -- -- --  ----------------  --------------------
  61 10 98 b0 8b a7 40 00      00:20:27.547  WRITE FPDMA QUEUED
  61 08 90 a0 8b a7 40 00      00:20:27.547  WRITE FPDMA QUEUED
  61 10 88 88 8b a7 40 00      00:20:27.547  WRITE FPDMA QUEUED
  61 18 80 60 8b a7 40 00      00:20:27.547  WRITE FPDMA QUEUED
  61 10 78 48 8b a7 40 00      00:20:27.547  WRITE FPDMA QUEUED

SMART Self-test log structure revision number 1
Num  Test_Description    Status                  Remaining  LifeTime(hours)  LBA_of_first_error
# 1  Short offline       Completed without error       00%      4447         -
# 2  Vendor (0x50)       Completed without error       00%      2009         -
# 3  Short offline       Completed without error       00%      2009         -
# 4  Vendor (0x50)       Completed without error       00%      1340         -
# 5  Short offline       Completed without error       00%      1340         -

SMART Selective self-test log data structure revision number 1
 SPAN  MIN_LBA  MAX_LBA  CURRENT_TEST_STATUS
    1        0        0  Not_testing
    2        0        0  Not_testing
    3        0        0  Not_testing
    4        0        0  Not_testing
    5        0        0  Not_testing
Selective self-test flags (0x0):
  After scanning selected spans, do NOT read-scan remainder of disk.
If Selective self-test is pending on power-up, resume after 0 minute delay.

please help me understand the condition of my drive.

1 Like

If that output seems too much complicated for you to understand you can see a clear table on Disks > Drive Options (on the left of Minimize button) > SMART data and tests…, where on the last column it will show the results, on mine all are OK. Yours look fine to me, I read no values on WHEN_FAILED column so apparently there's nothing bad on the disk, also SMART overall-health self-assessment test result: PASSED but I read error 159, 160, 161, 162 and 163, not sure what happened exactly.

1 Like

Is there any documentation where i could read the meaning of these errors?

These are the last 5 errors that could be stored, because device log contains only the most recent five errors:

Error: ICRC, ABRT at LBA = 0x00a78a1f = 10979871
Error: ICRC, ABRT at LBA = 0x00832877 = 8595575
Error: ICRC, ABRT at LBA = 0x0016c6b7 = 1492663
Error: ICRC, ABRT at LBA = 0x00d78abf = 14125759
Error: ICRC, ABRT at LBA = 0x00153027 = 1388583

I searched Error: ICRC, ABRT at LBA and the results tell that data was corrupted during the transfer and the most likely cause is a bad cable.

Then i think i should get hardware checked out then.

If your cable is evidently damaged it can prove what I read, otherwise you can even keep on using your actual disk. Did you run a test through Disks as I suggested on my first message? That way you can see clearer results, if OK or not. But I enjoyed analyzing your report so thoroughly, I have never done it so accurately because usually of error logs like that I don't understand a line :rofl:. Disks is on Zorin menu (logo button) > Utilities, then follow the procedure of my first message.

yes, heres the results- all ok.

1 Like

What I'm worried about is Throughput Performance and Seek Time Performance that show N/A, I have a value on ALL parameters.


But as the result is an OK for all parameters, that 5 errors can be ignored. What were the filesystem errors exactly? For example, one day I had an inconsistent filesystem error. You should read a specific name of your filesystem error, that can be really helpful to understand the problem accurately.

The filesystem had become read-only. i think it solved using fsck.

1 Like

To be honest, the online page has way too many commands which is incomprehensible for my brain. I'd be very grateful if you could tell me what that error logging command is.

i did smartctl --log=xerror, output-

root@Jayesh-IdeaPad:~# smartctl --log=xerror /dev/sda2
smartctl 7.1 2019-12-30 r5022 [x86_64-linux-5.15.0-70-generic] (local build)
Copyright (C) 2002-19, Bruce Allen, Christian Franke, www.smartmontools.org

=== START OF READ SMART DATA SECTION ===
SMART Extended Comprehensive Error Log Version: 1 (64 sectors)
Device Error Count: 163
	CR     = Command Register
	FEATR  = Features Register
	COUNT  = Count (was: Sector Count) Register
	LBA_48 = Upper bytes of LBA High/Mid/Low Registers ]  ATA-8
	LH     = LBA High (was: Cylinder High) Register    ]   LBA
	LM     = LBA Mid (was: Cylinder Low) Register      ] Register
	LL     = LBA Low (was: Sector Number) Register     ]
	DV     = Device (was: Device/Head) Register
	DC     = Device Control Register
	ER     = Error register
	ST     = Status register
Powered_Up_Time is measured from power on, and printed as
DDd+hh:mm:SS.sss where DD=days, hh=hours, mm=minutes,
SS=sec, and sss=millisec. It "wraps" after 49.710 days.

Error 163 [162] occurred at disk power-on lifetime: 4956 hours (206 days + 12 hours)
  When the command that caused the error occurred, the device was active or idle.

  After command completion occurred, registers were:
  ER -- ST COUNT  LBA_48  LH LM LL DV DC
  -- -- -- == -- == == == -- -- -- -- --
  84 -- 41 00 e0 00 00 3a 15 30 27 40 00  Error: ICRC, ABRT at LBA = 0x3a153027 = 974467111

  Commands leading to the command that caused the error were:
  CR FEATR COUNT  LBA_48  LH LM LL DV DC  Powered_Up_Time  Command/Feature_Name
  -- == -- == -- == == == -- -- -- -- --  ---------------  --------------------
  60 00 08 00 10 00 00 05 64 31 78 40 00     00:01:14.677  READ FPDMA QUEUED
  61 00 58 00 f0 00 00 27 d7 8a 68 40 00     00:01:14.677  WRITE FPDMA QUEUED
  60 01 00 00 e8 00 00 01 5d 24 00 40 00     00:01:14.677  READ FPDMA QUEUED
  61 00 40 00 e0 00 00 3a 15 2f e8 40 00     00:01:14.677  WRITE FPDMA QUEUED
  ef 00 10 00 03 00 00 00 00 00 00 a0 00     00:01:14.677  SET FEATURES [Enable SATA feature]

Error 162 [161] occurred at disk power-on lifetime: 4956 hours (206 days + 12 hours)
  When the command that caused the error occurred, the device was active or idle.

  After command completion occurred, registers were:
  ER -- ST COUNT  LBA_48  LH LM LL DV DC
  -- -- -- == -- == == == -- -- -- -- --
  84 -- 41 00 20 00 00 27 d7 8a bf 40 00  Error: ICRC, ABRT at LBA = 0x27d78abf = 668437183

  Commands leading to the command that caused the error were:
  CR FEATR COUNT  LBA_48  LH LM LL DV DC  Powered_Up_Time  Command/Feature_Name
  -- == -- == -- == == == -- -- -- -- --  ---------------  --------------------
  60 01 00 00 c8 00 00 01 5d 23 00 40 00     00:01:14.247  READ FPDMA QUEUED
  61 00 58 00 20 00 00 27 d7 8a 68 40 00     00:01:14.247  WRITE FPDMA QUEUED
  61 00 58 00 08 00 00 27 d7 98 00 40 00     00:01:14.246  WRITE FPDMA QUEUED
  60 00 f8 00 00 00 00 05 64 31 00 40 00     00:01:14.244  READ FPDMA QUEUED
  60 01 00 00 b8 00 00 05 63 5f 00 40 00     00:01:14.243  READ FPDMA QUEUED

Error 161 [160] occurred at disk power-on lifetime: 4955 hours (206 days + 11 hours)
  When the command that caused the error occurred, the device was active or idle.

  After command completion occurred, registers were:
  ER -- ST COUNT  LBA_48  LH LM LL DV DC
  -- -- -- == -- == == == -- -- -- -- --
  84 -- 41 00 10 00 00 3a 16 c6 b7 40 00  Error: ICRC, ABRT at LBA = 0x3a16c6b7 = 974571191

  Commands leading to the command that caused the error were:
  CR FEATR COUNT  LBA_48  LH LM LL DV DC  Powered_Up_Time  Command/Feature_Name
  -- == -- == -- == == == -- -- -- -- --  ---------------  --------------------
  61 00 08 00 10 00 00 3a 16 c6 b0 40 00     00:22:34.223  WRITE FPDMA QUEUED
  ea 00 00 00 00 00 00 00 00 00 00 a0 00     00:22:34.191  FLUSH CACHE EXT
  61 00 88 00 00 00 00 3a 16 c6 28 40 00     00:22:34.191  WRITE FPDMA QUEUED
  61 00 98 00 f8 00 00 73 80 54 00 40 00     00:22:34.190  WRITE FPDMA QUEUED
  ea 00 00 00 00 00 00 00 00 00 00 a0 00     00:22:32.578  FLUSH CACHE EXT

Error 160 [159] occurred at disk power-on lifetime: 4955 hours (206 days + 11 hours)
  When the command that caused the error occurred, the device was active or idle.

  After command completion occurred, registers were:
  ER -- ST COUNT  LBA_48  LH LM LL DV DC
  -- -- -- == -- == == == -- -- -- -- --
  84 -- 41 00 20 00 00 73 83 28 77 40 00  Error: ICRC, ABRT at LBA = 0x73832877 = 1937975415

  Commands leading to the command that caused the error were:
  CR FEATR COUNT  LBA_48  LH LM LL DV DC  Powered_Up_Time  Command/Feature_Name
  -- == -- == -- == == == -- -- -- -- --  ---------------  --------------------
  61 00 18 00 20 00 00 73 83 28 60 40 00     00:20:48.344  WRITE FPDMA QUEUED
  60 00 28 00 58 00 00 4b 91 30 08 40 00     00:20:46.690  READ FPDMA QUEUED
  60 01 00 00 f0 00 00 4b 91 2f 08 40 00     00:20:46.685  READ FPDMA QUEUED
  60 01 00 00 e8 00 00 4b 91 2d d8 40 00     00:20:46.660  READ FPDMA QUEUED
  ea 00 00 00 00 00 00 00 00 00 00 a0 00     00:20:46.568  FLUSH CACHE EXT

Error 159 [158] occurred at disk power-on lifetime: 4955 hours (206 days + 11 hours)
  When the command that caused the error occurred, the device was active or idle.

  After command completion occurred, registers were:
  ER -- ST COUNT  LBA_48  LH LM LL DV DC
  -- -- -- == -- == == == -- -- -- -- --
  84 -- 41 00 38 00 00 12 a7 8a 1f 40 00  Error: ICRC, ABRT at LBA = 0x12a78a1f = 312969759

  Commands leading to the command that caused the error were:
  CR FEATR COUNT  LBA_48  LH LM LL DV DC  Powered_Up_Time  Command/Feature_Name
  -- == -- == -- == == == -- -- -- -- --  ---------------  --------------------
  61 00 10 00 98 00 00 12 a7 8b b0 40 00     00:20:27.547  WRITE FPDMA QUEUED
  61 00 08 00 90 00 00 12 a7 8b a0 40 00     00:20:27.547  WRITE FPDMA QUEUED
  61 00 10 00 88 00 00 12 a7 8b 88 40 00     00:20:27.547  WRITE FPDMA QUEUED
  61 00 18 00 80 00 00 12 a7 8b 60 40 00     00:20:27.547  WRITE FPDMA QUEUED
  61 00 10 00 78 00 00 12 a7 8b 48 40 00     00:20:27.547  WRITE FPDMA QUEUED

Error 158 [157] occurred at disk power-on lifetime: 4954 hours (206 days + 10 hours)
  When the command that caused the error occurred, the device was active or idle.

  After command completion occurred, registers were:
  ER -- ST COUNT  LBA_48  LH LM LL DV DC
  -- -- -- == -- == == == -- -- -- -- --
  84 -- 41 00 e0 00 00 07 3c 92 07 40 00  Error: ICRC, ABRT at LBA = 0x073c9207 = 121410055

  Commands leading to the command that caused the error were:
  CR FEATR COUNT  LBA_48  LH LM LL DV DC  Powered_Up_Time  Command/Feature_Name
  -- == -- == -- == == == -- -- -- -- --  ---------------  --------------------
  60 00 08 00 68 00 00 4c 5d 18 58 40 00     00:06:44.504  READ FPDMA QUEUED
  60 00 78 00 60 00 00 24 d0 0f 90 40 00     00:06:44.504  READ FPDMA QUEUED
  60 00 78 00 58 00 00 24 d0 0f 08 40 00     00:06:44.504  READ FPDMA QUEUED
  60 00 08 00 50 00 00 24 d0 0f 80 40 00     00:06:44.504  READ FPDMA QUEUED
  61 00 10 00 48 00 00 07 3c 91 00 40 00     00:06:44.504  WRITE FPDMA QUEUED

Error 157 [156] occurred at disk power-on lifetime: 4929 hours (205 days + 9 hours)
  When the command that caused the error occurred, the device was active or idle.

  After command completion occurred, registers were:
  ER -- ST COUNT  LBA_48  LH LM LL DV DC
  -- -- -- == -- == == == -- -- -- -- --
  84 -- 41 00 30 00 00 4c 10 2b 47 40 00  Error: ICRC, ABRT at LBA = 0x4c102b47 = 1276128071

  Commands leading to the command that caused the error were:
  CR FEATR COUNT  LBA_48  LH LM LL DV DC  Powered_Up_Time  Command/Feature_Name
  -- == -- == -- == == == -- -- -- -- --  ---------------  --------------------
  61 00 08 00 30 00 00 4c 10 2b 40 40 00     00:04:29.737  WRITE FPDMA QUEUED
  60 00 08 00 28 00 00 14 15 1d c0 40 00     00:04:29.737  READ FPDMA QUEUED
  ef 00 10 00 03 00 00 00 00 00 00 a0 00     00:04:29.737  SET FEATURES [Enable SATA feature]
  ef 00 10 00 02 00 00 00 00 00 00 a0 00     00:04:29.727  SET FEATURES [Enable SATA feature]
  ec 00 00 00 00 00 00 00 00 00 00 a0 00     00:04:29.726  IDENTIFY DEVICE

Error 156 [155] occurred at disk power-on lifetime: 4929 hours (205 days + 9 hours)
  When the command that caused the error occurred, the device was active or idle.

  After command completion occurred, registers were:
  ER -- ST COUNT  LBA_48  LH LM LL DV DC
  -- -- -- == -- == == == -- -- -- -- --
  84 -- 41 00 a0 00 00 66 b0 e3 7f 40 00  Error: ICRC, ABRT at LBA = 0x66b0e37f = 1722868607

  Commands leading to the command that caused the error were:
  CR FEATR COUNT  LBA_48  LH LM LL DV DC  Powered_Up_Time  Command/Feature_Name
  -- == -- == -- == == == -- -- -- -- --  ---------------  --------------------
  61 00 18 00 c0 00 00 00 e6 2e 08 40 00     00:04:27.474  WRITE FPDMA QUEUED
  61 00 10 00 b8 00 00 00 e6 2d f0 40 00     00:04:27.474  WRITE FPDMA QUEUED
  61 00 28 00 b0 00 00 00 e6 2d b0 40 00     00:04:27.474  WRITE FPDMA QUEUED
  61 00 08 00 a8 00 00 00 e6 2d 98 40 00     00:04:27.474  WRITE FPDMA QUEUED
  61 01 80 00 a0 00 00 66 b0 e2 00 40 00     00:04:27.474  WRITE FPDMA QUEUED

This topic was automatically closed 90 days after the last reply. New replies are no longer allowed.