Hi guys,
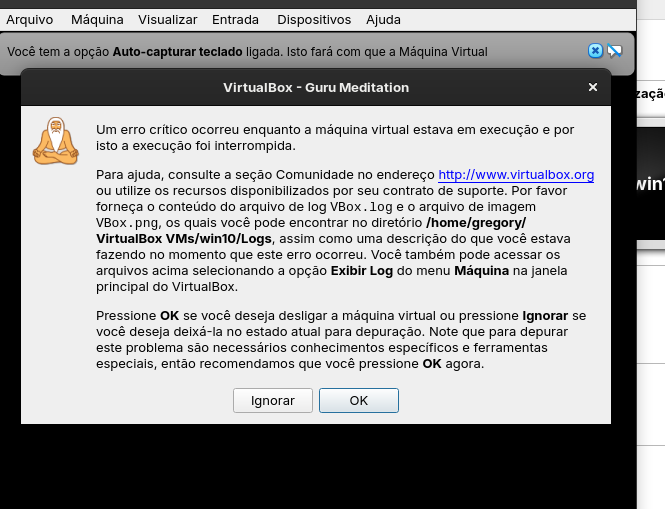
Since Zorin 17 I can't use VirtualBox, when runn VM pops up - GURU MEDITATION error. Anyone can help how to fix it?
Hi guys,
Since Zorin 17 I can't use VirtualBox, when runn VM pops up - GURU MEDITATION error. Anyone can help how to fix it?
Have you checked that virtualization support is disabled in your BIOS Settings?
Is enabled. I found o the other forum that it can be kernel issue.
I would try disabling this, first only out of ease. Also, is Secure Boot enabled in BIOS settings? It can interfere with vboxdrv module.
Do you have any other virtualization software like KVM? And, does this happen with already existing images or also with new ones that you create now?
No, I don't have any KVM.
Virtualisation in BIOS in enabled.
I turned off secure boot and still nothing.
But when installed on POP OS, VB works fully.
Do you have the error message in full? What you can try to get it is launch a VM in order to trigger the error, and immediately after head over to the Terminal and run:
sudo tail -n 100 /var/log/syslog > output.txt
This will save the last 100 lines of this log file into a text file called "output.txt". You can read through it to see if there's something interesting about this error, perhaps a more specific error code that we can look up. If you prefer you can also upload to an online service like https://paste.debian.net/ so that we can take a look.
Well, I beleive I'm having the same issue.
Here is the last log lines.
:03.579353 /PDM/Queue/DevHlp/AllocFailures 0 times
00:00:03.579356 /PDM/Queue/DevHlp/Flush 0 calls
00:00:03.579360 /PDM/Queue/DevHlp/FlushLeftovers 0 times
00:00:03.579363 /PDM/Queue/DevHlp/Insert 0 calls
00:00:03.579366 /PDM/Queue/DevHlp/cItems 8 count
00:00:03.579370 /PDM/Queue/DevHlp/cbItem 64 bytes
00:00:03.579374 /PDM/Queue/Keyboard/AllocFailures 0 times
00:00:03.579377 /PDM/Queue/Keyboard/Flush 0 calls
00:00:03.579382 /PDM/Queue/Keyboard/FlushLeftovers 0 times
00:00:03.579385 /PDM/Queue/Keyboard/Insert 0 calls
00:00:03.579387 /PDM/Queue/Keyboard/cItems 64 count
00:00:03.579389 /PDM/Queue/Keyboard/cbItem 32 bytes
00:00:03.579391 /PDM/Queue/Mouse/AllocFailures 0 times
00:00:03.579393 /PDM/Queue/Mouse/Flush 0 calls
00:00:03.579395 /PDM/Queue/Mouse/FlushLeftovers 0 times
00:00:03.579396 /PDM/Queue/Mouse/Insert 0 calls
00:00:03.579398 /PDM/Queue/Mouse/cItems 128 count
00:00:03.579404 /PDM/Queue/Mouse/cbItem 48 bytes
00:00:03.579407 /PDM/Queue/Mouse_1/AllocFailures 0 times
00:00:03.579409 /PDM/Queue/Mouse_1/Flush 0 calls
00:00:03.579411 /PDM/Queue/Mouse_1/FlushLeftovers 0 times
00:00:03.579413 /PDM/Queue/Mouse_1/Insert 0 calls
00:00:03.579415 /PDM/Queue/Mouse_1/cItems 128 count
00:00:03.579417 /PDM/Queue/Mouse_1/cbItem 48 bytes
00:00:03.579419 /PDM/Queue/SCSI-Eject/AllocFailures 0 times
00:00:03.579421 /PDM/Queue/SCSI-Eject/Flush 0 calls
00:00:03.579423 /PDM/Queue/SCSI-Eject/FlushLeftovers 0 times
00:00:03.579424 /PDM/Queue/SCSI-Eject/Insert 0 calls
00:00:03.579426 /PDM/Queue/SCSI-Eject/cItems 1 count
00:00:03.579428 /PDM/Queue/SCSI-Eject/cbItem 40 bytes
00:00:03.579430 /PDM/Tasks/000-E1000-Xmit-retriggered 0 times
00:00:03.579432 /PDM/Tasks/000-E1000-Xmit-runs 0 times
00:00:03.579434 /PDM/Tasks/001-HDA CORB DMA-retriggered 0 times
00:00:03.579436 /PDM/Tasks/001-HDA CORB DMA-runs 0 times
00:00:03.579438 /PGM/CPU0/cA20Changes 0 times
00:00:03.579440 /PGM/CPU0/cGuestModeChanges 1 times
00:00:03.579442 /PGM/ChunkR3Map/Mapped 1 count
00:00:03.579444 /PGM/ChunkR3Map/Unmapped 0 count
00:00:03.579446 /PGM/ChunkR3Map/c 1 count
00:00:03.579448 /PGM/ChunkR3Map/cMax 4294967295 count
00:00:03.579450 /PGM/LargePage/Recheck 0 times
00:00:03.579452 /PGM/LargePage/Refused 0 times
00:00:03.579454 /PGM/LargePage/Reused 0 times
00:00:03.579457 /PGM/Mmio2QueryAndResetDirtyBitmap 0 ticks/call ( 0 ticks, 0 times, max 0, min -1)
00:00:03.579459 /PGM/Page/cAllPages 558607 count
00:00:03.579462 /PGM/Page/cBalloonedPages 0 count
00:00:03.579464 /PGM/Page/cHandyPages 128 count
00:00:03.579466 /PGM/Page/cLargePages 0 count
00:00:03.579468 /PGM/Page/cLargePagesDisabled 0 count
00:00:03.579469 /PGM/Page/cMonitoredPages 0 count
00:00:03.579471 /PGM/Page/cPrivatePages 34487 count
00:00:03.579473 /PGM/Page/cPureMmioPages 34 count
00:00:03.579475 /PGM/Page/cReadLockedPages 0 count
00:00:03.579477 /PGM/Page/cReusedSharedPages 0 count
00:00:03.579479 /PGM/Page/cSharedPages 0 count
00:00:03.579481 /PGM/Page/cWriteLockedPages 0 count
00:00:03.579483 /PGM/Page/cWrittenToPages 0 count
00:00:03.579485 /PGM/Page/cZeroPages 524086 count
00:00:03.579487 /PGM/Pool/Grow 1172991 ticks ( 1172991 ticks, 1 times, max 1172991, min 1172991)
00:00:03.579491 /PGM/ShMod/Check 0 ticks/call ( 0 ticks, 0 times, max 0, min -1)
00:00:03.579493 /PGM/cRelocations 0 times
00:00:03.579495 /PROF/CPU0/EM/Capped 0 ticks/call ( 0 ticks, 0 times, max 0, min -1)
00:00:03.579498 /PROF/CPU0/EM/ForcedActions 0 times
00:00:03.579500 /PROF/CPU0/EM/Halted 0 times
00:00:03.579502 /PROF/CPU0/EM/NEMExec 0 ticks/call ( 0 ticks, 0 times, max 0, min -1)
00:00:03.579504 /PROF/CPU0/EM/NEMExecuteCalled 0 times
00:00:03.579506 /PROF/CPU0/EM/RAWTotal 0 times
00:00:03.579508 /PROF/CPU0/EM/REMTotal 0 times
00:00:03.579510 /PROF/CPU0/EM/RecordedExits 2 times
00:00:03.579512 /PROF/CPU0/EM/Total 2133299204 ticks/call ( 2133299204 ticks, 1 times, max 2133299204, min 2133299204)
00:00:03.579515 /PROF/CPU0/VM/Halt/Block 0 ns/call ( 0 ticks, 0 times, max 0, min -1)
00:00:03.579518 /PROF/CPU0/VM/Halt/BlockInsomnia 0 ns/call ( 0 ticks, 0 times, max 0, min -1)
00:00:03.579523 /PROF/CPU0/VM/Halt/BlockOnTime 0 ns/call ( 0 ticks, 0 times, max 0, min -1)
00:00:03.579526 /PROF/CPU0/VM/Halt/BlockOverslept 0 ns/call ( 0 ticks, 0 times, max 0, min -1)
00:00:03.579528 /PROF/CPU0/VM/Halt/R0HaltBlock 0 ns/call ( 0 ticks, 0 times, max 0, min -1)
00:00:03.579531 /PROF/CPU0/VM/Halt/R0HaltBlockInsomnia 0 ns/call ( 0 ticks, 0 times, max 0, min -1)
00:00:03.579533 /PROF/CPU0/VM/Halt/R0HaltBlockOnTime 0 ns/call ( 0 ticks, 0 times, max 0, min -1)
00:00:03.579535 /PROF/CPU0/VM/Halt/R0HaltBlockOverslept 0 ns/call ( 0 ticks, 0 times, max 0, min -1)
00:00:03.579538 /PROF/CPU0/VM/Halt/R0HaltExec 0 times
00:00:03.579540 /PROF/CPU0/VM/Halt/R0HaltExec/FromBlock 0 times
00:00:03.579542 /PROF/CPU0/VM/Halt/R0HaltExec/FromSpin 0 times
00:00:03.579543 /PROF/CPU0/VM/Halt/R0HaltHistoryCounter 0 times
00:00:03.579545 /PROF/CPU0/VM/Halt/R0HaltHistorySucceeded 0 times
00:00:03.579547 /PROF/CPU0/VM/Halt/R0HaltHistoryToRing3 0 times
00:00:03.579549 /PROF/CPU0/VM/Halt/R0HaltToR3 0 times
00:00:03.579551 /PROF/CPU0/VM/Halt/R0HaltToR3/FromSpin 0 times
00:00:03.579553 /PROF/CPU0/VM/Halt/R0HaltToR3/Other 0 times
00:00:03.579555 /PROF/CPU0/VM/Halt/R0HaltToR3/PendingFF 0 times
00:00:03.579556 /PROF/CPU0/VM/Halt/R0HaltToR3/PostWaitNoInt 0 times
00:00:03.579558 /PROF/CPU0/VM/Halt/R0HaltToR3/PostWaitPendingFF 0 times
00:00:03.579560 /PROF/CPU0/VM/Halt/R0HaltToR3/SmallDelta 0 times
00:00:03.579562 /PROF/CPU0/VM/Halt/Timers 0 ns/call ( 0 ticks, 0 times, max 0, min -1)
00:00:03.579564 /PROF/CPU0/VM/Halt/Yield 0 ns/call ( 0 ticks, 0 times, max 0, min -1)
00:00:03.579567 /Public/NetAdapter/0/BytesReceived 0 bytes
00:00:03.579569 /Public/NetAdapter/0/BytesTransmitted 0 bytes
00:00:03.579571 /Public/NetAdapter/0/e1000 0
00:00:03.579574 /Public/Storage/AHCI0/Port0/QueryBufAttempts 0 count
00:00:03.579575 /Public/Storage/AHCI0/Port0/QueryBufSuccess 0 count
00:00:03.579578 /SELM/LoadHidSel/GstReadErrors 0 times
00:00:03.579580 /SELM/LoadHidSel/NoGoodGuest 0 times
00:00:03.579582 /TM/CPU/00/cNsExecuting 5094 ns
00:00:03.579584 /TM/CPU/00/cNsHalted 0 ns
00:00:03.579586 /TM/CPU/00/cNsOther 205312 ns
00:00:03.579588 /TM/CPU/00/cNsTotal 210406 ns
00:00:03.579590 /TM/CPU/00/cPeriodsExecuting 2 count
00:00:03.579592 /TM/CPU/00/cPeriodsHalted 0 count
00:00:03.579594 /TM/CPU/00/pctExecuting 0 %
00:00:03.579596 /TM/CPU/00/pctHalted 0 %
00:00:03.579598 /TM/CPU/00/pctOther 0 %
00:00:03.579600 /TM/CPU/pctExecuting 0 %
00:00:03.579602 /TM/CPU/pctHalted 0 %
00:00:03.579604 /TM/CPU/pctOther 0 %
00:00:03.579606 /TM/MaxHzHint 0 Hz
00:00:03.579608 /TM/PIT/Handler 0 ticks/call ( 0 ticks, 0 times, max 0, min -1)
00:00:03.579611 /TM/PIT/Irq 0 times
00:00:03.579613 /TM/TSC/offCPU0 0 ticks
00:00:03.579615 /TM/VirtualSync/CurrentOffset 0 ns
00:00:03.579617 /VUSB/0/cUrbsInPool 0 count
00:00:03.579620 ********************* End of statistics **********************
00:00:03.579682 VUSB: Detached 'HidMouse' from port 1 on RootHub#0
00:00:03.593822 NAT: Zone(nm:mbuf_cluster, used:0)
00:00:03.594489 NAT: Zone(nm:mbuf_packet, used:0)
00:00:03.594497 NAT: Zone(nm:mbuf, used:0)
00:00:03.594500 NAT: Zone(nm:mbuf_jumbo_pagesize, used:0)
00:00:03.595165 NAT: Zone(nm:mbuf_jumbo_9k, used:0)
00:00:03.595407 NAT: Zone(nm:mbuf_jumbo_16k, used:0)
00:00:03.595545 NAT: Zone(nm:mbuf_ext_refcnt, used:0)
00:00:03.595570 E1000#0: Interrupt attempts: 0
00:00:03.595574 E1000#0: Interrupts raised : 0
00:00:03.595576 E1000#0: Interrupts lowered: 0
00:00:03.595579 E1000#0: ICR outside ISR : 0
00:00:03.595581 E1000#0: IMS raised ints : 0
00:00:03.595583 E1000#0: Interrupts skipped: 0
00:00:03.595585 E1000#0: Masked interrupts : 0
00:00:03.595587 E1000#0: Early interrupts : 0
00:00:03.595590 E1000#0: Late interrupts : 0
00:00:03.595592 E1000#0: Lost interrupts : 0
00:00:03.595594 E1000#0: Interrupts by RX : 0
00:00:03.595596 E1000#0: Interrupts by TX : 0
00:00:03.595598 E1000#0: Interrupts by ICS : 0
00:00:03.595600 E1000#0: Interrupts by RDTR: 0
00:00:03.595602 E1000#0: Interrupts by RDMT: 0
00:00:03.595605 E1000#0: Interrupts by TXQE: 0
00:00:03.595607 E1000#0: TX int delay asked: 0
00:00:03.595609 E1000#0: TX delayed: 0
00:00:03.595611 E1000#0: TX delay expired: 0
00:00:03.595613 E1000#0: TX no report asked: 0
00:00:03.595615 E1000#0: TX abs timer expd : 0
00:00:03.595617 E1000#0: TX int timer expd : 0
00:00:03.595619 E1000#0: RX abs timer expd : 0
00:00:03.595622 E1000#0: RX int timer expd : 0
00:00:03.595624 E1000#0: TX CTX descriptors: 0
00:00:03.595626 E1000#0: TX DAT descriptors: 0
00:00:03.595628 E1000#0: TX LEG descriptors: 0
00:00:03.595630 E1000#0: Received frames : 0
00:00:03.595632 E1000#0: Transmitted frames: 0
00:00:03.595634 E1000#0: TX frames up to 1514: 0
00:00:03.595636 E1000#0: TX frames up to 2962: 0
00:00:03.595639 E1000#0: TX frames up to 4410: 0
00:00:03.595641 E1000#0: TX frames up to 5858: 0
00:00:03.595643 E1000#0: TX frames up to 7306: 0
00:00:03.595645 E1000#0: TX frames up to 8754: 0
00:00:03.595647 E1000#0: TX frames up to 16384: 0
00:00:03.595649 E1000#0: TX frames up to 32768: 0
00:00:03.595651 E1000#0: Larger TX frames : 0
00:00:03.595654 E1000#0: Max TX Delay : 0
00:00:03.623338 GIM: HyperV: Resetting MMIO2 regions and MSRs
00:00:03.624648 Changing the VM state from 'DESTROYING' to 'TERMINATED'
00:00:03.630002 Console: Machine state changed to 'PoweredOff'
00:00:04.168074 GUI: Passing request to close Runtime UI from machine-logic to UI session.
00:00:04.173358 GUI: UIMachineViewNormal::resendSizeHint: Restoring guest size-hint for screen 0 to 800x600
00:00:04.173442 ERROR [COM]: aRC=E_ACCESSDENIED (0x80070005) aIID={4680b2de-8690-11e9-b83d-5719e53cf1de} aComponent={DisplayWrap} aText={The console is not powered up (setVideoModeHint)}, preserve=false aResultDetail=0
00:00:04.173593 GUI: Aborting startup due to invalid machine state detected: 1
Do yourselves a favour and switch to Vcenter Workstation 17.x free for personal use. I finally gave up on VB a while back and switched over and certainly glad i did.
Hi there, what version of VirtualBox are you using. It sounds like maybe 6.something? You can find out in the Help/About VirtualBox tab.
Of course this might also be a good alternative to VirtualBox:
That error message points to a log file with more information, did you look at it?
This topic was automatically closed 90 days after the last reply. New replies are no longer allowed.