Sorry, that part was for the Mint ppa
Try
sudo apt update && sudo apt install conky-manager
If that fails, try
sudo apt update && sudo apt install conky-manager2
Sorry, that part was for the Mint ppa
Try
sudo apt update && sudo apt install conky-manager
If that fails, try
sudo apt update && sudo apt install conky-manager2
Conky seems a bit out of its normal configuration. I didn't ask, bu what is it for? Is it a fancy system monitor?
... I think it is easier if I show you...
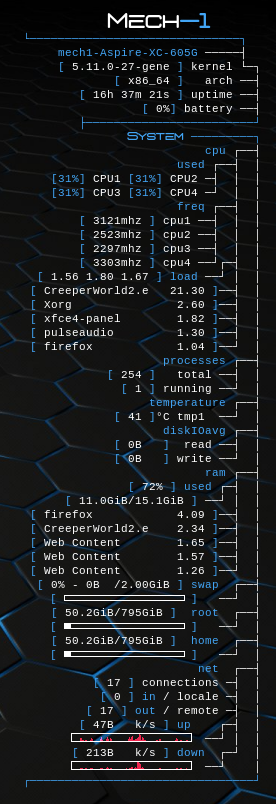
Here is my conky:
It is a HUD that operates in the background and does not interact or interfere with the desktop.
You can see in the image that I can actively monitor i/o, temps, CPU usage, Running Processes, RAM, etc.
This is very handy for such times as what you are experiencing, where a mysterious unknown is acting up, but not showing up strongly in the system logs.
Can you share your conky with me? I mean, the same layout and stuff
  ${alignr}└──────────────────────────────┐
  ${alignr}${nodename}${color} ─────┤
   ${alignr}${color1}${color1}[${color}${color} ${exec uname -r | cut -c 1-14} ${color1}]${color} kernel └─┐
   ${alignr}${color1}[${color} $machine ${color1}]${color}   arch ──┤
   ${alignr}${color1}[${color} $uptime ${color1}]${color} uptime ──┤
   ${alignr}${color1}[${color} ${battery_percent BAT1}%${color1}]${color} battery ──┤
   ${alignr}${color1} ├────────────────────────┘${color}
   ${alignr}${font D3Euronism:pixelsize=12}${color1} System${font} ─────────┐
   ${alignr}${color1} cpu${color} ┌──┤
   ${alignr}${color1} used${color} ┌──┤  │
   ${alignr}${color2}[${cpu 1}%]${color} CPU1 ${color2}[${color}${color2}${cpu 2}%]${color} CPU2 ─┤  │  │
   ${alignr}${color2}[${cpu 3}%]${color} CPU3 ${color2}[${color}${color2}${cpu 4}%]${color} CPU4 ─┘  │  │
   ${alignr}${color1}freq${color} ┌──┤  │
   ${alignr}${color1}[${color} ${freq 1}mhz ${color1}]${color} cpu1 ──┤  │  │
   ${alignr}${color1}[${color} ${freq 2}mhz ${color1}]${color} cpu2 ──┤  │  │
   ${alignr}${color1}[${color} ${freq 3}mhz ${color1}]${color} cpu3 ──┤  │  │
   ${alignr}${color1}[${color} ${freq 4}mhz ${color1}]${color} cpu4 ──┘┌─┤  │
   ${alignr}${color1}[${color} $loadavg ${color1}] load${color} ──┘ │  │
     ${alignr}${color2}[${color} ${top name 1} ${top cpu 1} ${color2}]${color}──┤  │
     ${alignr}${color2}[${color} ${top name 2} ${top cpu 2} ${color2}]${color}──┤  │
     ${alignr}${color2}[${color} ${top name 3} ${top cpu 3} ${color2}]${color}──┤  │
     ${alignr}${color2}[${color} ${top name 4} ${top cpu 4} ${color2}]${color}──┤  │
     ${alignr}${color2}[${color} ${top name 5} ${top cpu 5} ${color2}]${color}──┘  │
   ${alignr}${color1} processes${color} ┌──┤
   ${alignr}${color1}[${color} $processes ${color1}]${color}   total ──┤  │
   ${alignr}${color1}[${color} $running_processes ${color1}]${color} running ──┘  │
   ${alignr}${color1} temperature${color} ┌──┤
   ${alignr}${color1}[${color1} ${color3}${hwmon 2 temp 1} ${color1}]${color}°C tmp1  ──┘  │
 #${alignr}${color1}[${color} ${if_match ${exec sensors | grep -m 1 temp1 | awk '{print $2}' | cut -c 2-3}>=65}${color2}${exec sensors | grep -m 1 temp1 | awk '{print $2}' | cut -c 2-3}${else}${color1}${exec sensors | grep -m 1 temp1 | awk '{print $2}' | cut -c 2-3}#${endif}  ${color}${color} ${color1}]${color} tmp1 -─┘
   ${alignr}${color1}$font diskIOavg${color} ┌──┤
   ${alignr}${color1}[${color} $diskio_read ${color1}]${color}  read ──┤  │
   ${alignr}${color1}[${color} $diskio_write ${color1}]${color} write ──┘  │
   ${alignr}${color1}ram${color} ┌──┤
   ${alignr}${color1}[${color} $memperc% ${color1}]${color1} used${color} ┌─┤  │
   ${alignr}${color1}[${color} $mem/$memmax ${color1}]${color} ──┘ │  │
    ${alignr}${color2}[${color} ${top_mem name 1} ${top_mem mem 1} ${color2}]${color}──┤  │
    ${alignr}${color2}[${color} ${top_mem name 2} ${top_mem mem 2} ${color2}]${color}──┤  │
    ${alignr}${color2}[${color} ${top_mem name 3} ${top_mem mem 3} ${color2}]${color}──┤  │
    ${alignr}${color2}[${color} ${top_mem name 4} ${top_mem mem 4} ${color2}]${color}──┤  │
    ${alignr}${color2}[${color} ${top_mem name 5} ${top_mem mem 5} ${color2}]${color}──┘  │
   ${alignr}${color1}[${color} $swapperc% - $swap/$swapmax ${color1}] swap${color}  ┌──┤
   ${alignr}${color1}[${color} ${swapbar 5,120} ${color1}]${color}   ──┘  │
   ${alignr}${color1}[${color} ${fs_used /}/${fs_size /} ${color1}]  root${color}  ┌──┤
   ${alignr}${color1}[${color} ${fs_bar 5,120 /} ${color1}]${color}   ──┘  │
   ${alignr}${color1}[${color} ${fs_used /home}/${fs_size /home} ${color1}]  home${color}  ┌──┤
   ${alignr}${color1}[${color} ${fs_bar 5,120 /home/mech-1/} ${color1}]${color}   ──┘  │
   #${alignr}${color1}[${color} ${fs_used /usr/local}/${fs_size /usr/local} ${color1}]${color} local  ──┘
   #${alignr}${color1}[${color} ${fs_bar 5,120 /home/Container/} ${color1}]${color}  ──┘
   ${alignr}${color1} net${color}  ┌──┤
   ${alignr}${color1}[${color} ${tcp_portmon 1 65535 count} ${color1}]${color} connections ─┤  │
   ${alignr}${color1}[${color} ${tcp_portmon 1 32767 count} ${color1}]${color1} in${color} / locale ─┤  │
   ${alignr}${color1}[${color} ${tcp_portmon 32768 61000 count} ${color1}]${color1} out${color} / remote ─┤  │
   ${alignr}${color1}[${color} ${upspeed wlp3s0} k/s ${color1}]${color} ${color1}up ${color}   ┌─┤  │
   ${alignr}${color1}${color} ${upspeedgraph wlp3s0 8,120 DC143C DC143C} ${color1}${color} ──┘ │  │
   ${alignr}${color1}[${color} ${downspeed wlp3s0} k/s ${color1}]${color} ${color1}down${color}  ┌─┘  │
   ${alignr}${color1}${color} ${downspeedgraph wlp3s0 8,120 DC143C DC143C} ${color1}${color} ──┘    │
   ${alignr}${color1}┌────────────────────────────────┘
You will need to change certain values to make them work. Such as my network monitoring is set to wlp3s0, you may be the same, or it could be something different.
In terminal run netstat -ie to find yours.
How to do this? Copy it in a .txt file?
Save it to ~/.conky as zorinos-conkyrc )to make it easy to see in Conky Manager.)
As a .txt?
No, just as typed above.
Ok. I was able to create the file using the touch command, but how to edit it? (sorry for being a complete noob)
In any text editor you want.
Also, if you open Conky Manager, it will allow you to set the position and various other settings, changing the conkry for you.
It's ok - so am I.
gmhrmlz:-
As Aravisian says, Conky is more of a kind of HUD.....one that can be set to monitor almost any aspect of your system.
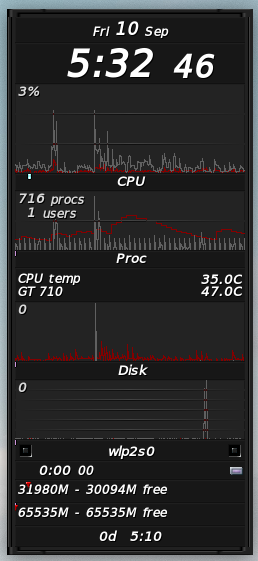
For a more traditional "system monitor", probably the best choice would be Bill Wilson's gKrellM:-
You can get this through the repos:-
sudo apt-get install gkrellm
Mine currently looks like this:-
The theme is one called "Dreamworks", and can be found via the gKrelM themes page from the srcbox site. You CAN set this to monitor every single core, but I personally prefer a general 'composite' chart, and a single temps reading.....just gives me a rough idea of what activity/temps are like.
Mike. 
Thanks for the tip.
I will try to use Discord on the Browser and see if the problem goes away. Maybe it does
This topic was automatically closed 90 days after the last reply. New replies are no longer allowed.