Hello,
Is it possible to display internet usage in the existing system monitoring tool?
Or
Is there another tool that does this?
Kind regards
Hello,
Is it possible to display internet usage in the existing system monitoring tool?
Or
Is there another tool that does this?
Kind regards
Are you looking for time-based stats like weekly / monthly usage or real-time usage up / down as it happens?
Conky.
sudo apt install conky-all
Here's my /etc/conky/conky.conf file (note the WiFi portion has SSID, WiFi Channel, Signal Quality, Maximum WiFi bandwidth, LAN IP address, WAN IP address, instantaneous upload bandwidth, instantaneous download bandwidth, upload and download bandwidth graphs, and total bandwidth consumed (upload and download) this boot):
conky.config = {
  alignment = 'top_right',
  background = true,
  border_inner_margin = 0,
  border_outer_margin = 1,
  border_width = 0.5,
  cpu_avg_samples = 4,
  default_color = '88CCFF',
  default_outline_color = 'CCCCCC',
  default_shade_color = '000000',
  double_buffer = true,
  draw_borders = true,
  draw_graph_borders = true,
  draw_outline = false,
  draw_shades = false,
  extra_newline = false,
  font = 'JetBrains Mono Regular:size=7',
  gap_x = 5,
  gap_y = 0,
  maximum_width = 252,
  minimum_height = 5,
  minimum_width = 252,
  net_avg_samples = 10,
  out_to_console = false,
  out_to_stderr = false,
  own_window = true,
  own_window_argb_visual = true,
  own_window_class = 'Conky',
  own_window_colour = '000000',
  own_window_hints = 'undecorated,below,sticky,skip_taskbar,skip_pager',
  own_window_transparent = true,
  own_window_type = 'panel',
  show_graph_range = false,
  show_graph_scale = false,
  stippled_borders = 0,
  temperature_unit = 'fahrenheit',
  top_cpu_separate = true,
  update_interval = 5.0,
  update_interval_on_battery = 60,
  uppercase = false,
  use_spacer = 'none',
  use_xft = true,
  xftalpha = 1

-- Load LUA script to change interval.
--  lua_load = '/etc/conky/conky_interval.lua'
}

conky.text = [[
#${if_match "  Monitor is Off" == "${execi 5 xset -q | sed -n '$p'}"}
#  ${lua conky_interval.lua 300}
#${else}
#  ${lua conky_interval.lua 5}
#${endif}

${color FFFFFF}${hr}
Uptime:${goto 50}${uptime}${goto 135}Time:${goto 170}${time %H:%M:%S}
${hr}
AMD Ryzen 5 5625 U${alignr}CPU Temp: ${hwmon 3 temp 1} F
${color FFFFFF}Core 00: ${cpu cpu1} % ${goto 80}${freq 1} MHz${goto 135}${color 3388FF}${cpubar cpu1 10,115}
${color FFFFFF}Core 01: ${cpu cpu2} % ${goto 80}${freq 2} MHz${goto 135}${color 3388FF}${cpubar cpu2 10,115}
${color FFFFFF}Core 02: ${cpu cpu3} % ${goto 80}${freq 3} MHz${goto 135}${color 3388FF}${cpubar cpu3 10,115}
${color FFFFFF}Core 03: ${cpu cpu4} % ${goto 80}${freq 4} MHz${goto 135}${color 3388FF}${cpubar cpu4 10,115}
${color FFFFFF}Core 04: ${cpu cpu5} % ${goto 80}${freq 5} MHz${goto 135}${color 3388FF}${cpubar cpu5 10,115}
${color FFFFFF}Core 05: ${cpu cpu6} % ${goto 80}${freq 6} MHz${goto 135}${color 3388FF}${cpubar cpu6 10,115}
${color FFFFFF}Core 06: ${cpu cpu7} % ${goto 80}${freq 7} MHz${goto 135}${color 3388FF}${cpubar cpu7 10,115}
${color FFFFFF}Core 07: ${cpu cpu8} % ${goto 80}${freq 8} MHz${goto 135}${color 3388FF}${cpubar cpu8 10,115}
${color FFFFFF}Core 08: ${cpu cpu9} % ${goto 80}${freq 9} MHz${goto 135}${color 3388FF}${cpubar cpu9 10,115}
${color FFFFFF}Core 09: ${cpu cpu10} % ${goto 80}${freq 10} MHz${goto 135}${color 3388FF}${cpubar cpu10 10,115}
${color FFFFFF}Core 10: ${cpu cpu11} % ${goto 80}${freq 11} MHz${goto 135}${color 3388FF}${cpubar cpu11 10,115}
${color FFFFFF}Core 11: ${cpu cpu12} % ${goto 80}${freq 12} MHz${goto 135}${color 3388FF}${cpubar cpu12 10,115}
${color FFFFFF}${hr}
Drive Free Space:${goto 90}${color 3388FF}${fs_bar_free 10,125 /}${color FFFFFF}${alignr}${fs_free_perc} %
RAM Usage:${goto 90}${color 3388FF}${memwithbuffersbar 10,125}${color FFFFFF}${alignr}${memperc} %
Swap Usage:${goto 90}${color 3388FF}${swapbar 10,125}${color FFFFFF}${alignr}${swapperc} %
${hr}
SSID: ${goto 30}${wireless_essid wlo1}${goto 70}Channel: ${wireless_channel wlo1}${goto 135}Quality: ${goto 180}${wireless_link_qual_perc wlo1} %${alignr}${wireless_bitrate wlo1}
LAN: ${goto 30}${addr wlo1}${goto 135}WAN: ${goto 180}${texeci 1800 curl -s https://ipv4.icanhazip.com}
Up: ${goto 30}${upspeed wlo1}/s  ${goto 135}Down: ${goto 180}${downspeed wlo1}/s
${color 3388FF}${upspeedgraph wlo1 25,124 FF0000 8B0000 -l -t}${alignr}${downspeedgraph wlo1 25,124 ABFF2C 12CD22 -l -t}
${color FFFFFF}Total: ${totalup wlo1}${alignr}Total: ${totaldown wlo1}
${hr}
Processes: ${processes}${alignr}Running: ${running_threads}
${hr}
Name${goto 105}MEM${goto 150}CPU%${alignr}PID
${top_mem name 1}${goto 105}${top_mem mem_res 1}${goto 150}${top_mem cpu 1}${alignr}${top_mem pid 1}
${top_mem name 2}${goto 105}${top_mem mem_res 2}${goto 150}${top_mem cpu 2}${alignr}${top_mem pid 2}
${top_mem name 3}${goto 105}${top_mem mem_res 3}${goto 150}${top_mem cpu 3}${alignr}${top_mem pid 3}
${top_mem name 4}${goto 105}${top_mem mem_res 4}${goto 150}${top_mem cpu 4}${alignr}${top_mem pid 4}
${top_mem name 5}${goto 105}${top_mem mem_res 5}${goto 150}${top_mem cpu 5}${alignr}${top_mem pid 5}
${top_mem name 6}${goto 105}${top_mem mem_res 6}${goto 150}${top_mem cpu 6}${alignr}${top_mem pid 6}
${top_mem name 7}${goto 105}${top_mem mem_res 7}${goto 150}${top_mem cpu 7}${alignr}${top_mem pid 7}
${top_mem name 8}${goto 105}${top_mem mem_res 8}${goto 150}${top_mem cpu 8}${alignr}${top_mem pid 8}
${top_mem name 9}${goto 105}${top_mem mem_res 9}${goto 150}${top_mem cpu 9}${alignr}${top_mem pid 9}
${top_mem name 10}${goto 105}${top_mem mem_res 10}${goto 150}${top_mem cpu 10}${alignr}${top_mem pid 10}
${hr}
Name${goto 105}CPU%${goto 150}MEM${alignr}PID
${top_time name 1}${goto 105}${top_time cpu 1}${goto 150}${top_time mem_res 1}${alignr}${top_time pid 1}
${top_time name 2}${goto 105}${top_time cpu 2}${goto 150}${top_time mem_res 2}${alignr}${top_time pid 2}
${top_time name 3}${goto 105}${top_time cpu 3}${goto 150}${top_time mem_res 3}${alignr}${top_time pid 3}
${top_time name 4}${goto 105}${top_time cpu 4}${goto 150}${top_time mem_res 4}${alignr}${top_time pid 4}
${top_time name 5}${goto 105}${top_time cpu 5}${goto 150}${top_time mem_res 5}${alignr}${top_time pid 5}
${top_time name 6}${goto 105}${top_time cpu 6}${goto 150}${top_time mem_res 6}${alignr}${top_time pid 6}
${top_time name 7}${goto 105}${top_time cpu 7}${goto 150}${top_time mem_res 7}${alignr}${top_time pid 7}
${top_time name 8}${goto 105}${top_time cpu 8}${goto 150}${top_time mem_res 8}${alignr}${top_time pid 8}
${top_time name 9}${goto 105}${top_time cpu 9}${goto 150}${top_time mem_res 9}${alignr}${top_time pid 9}
${top_time name 10}${goto 105}${top_time cpu 10}${goto 150}${top_time mem_res 10}${alignr}${top_time pid 10}
${color FFFFFF}${hr}
]]
The commented-out portions was my attempt to reduce Conky update interval when the screen was off... never got that working right, though.
I start it via Startup Applications:
Name: Conky
Command: nice /usr/bin/conky -p 10 19
Comment: Start Conky with low priority to keep CPU frequency low.
So the command starts Conky after a 10 second delay upon reaching the desktop (runlevel 5), with niceness of 19 (lowest priority).
I've further got:
Name: Ignore Nice Load
Command: sudo sh -c "echo 1 > /sys/devices/system/cpu/cpufreq/conservative/ignore_nice_load"
Comment: Sets CPU ignore_nice_load
That keeps the CPU from ramping up for long-running tasks with low priority. I'm using the Conservative CPU governor. You'd have to figure out which CPU governor you're using and change the command to reflect that if you want to use this.
I also use conky for this purpose.
real-time
Ok, I tried that but didn't really get it right.
I installed it, but then I got stuck.
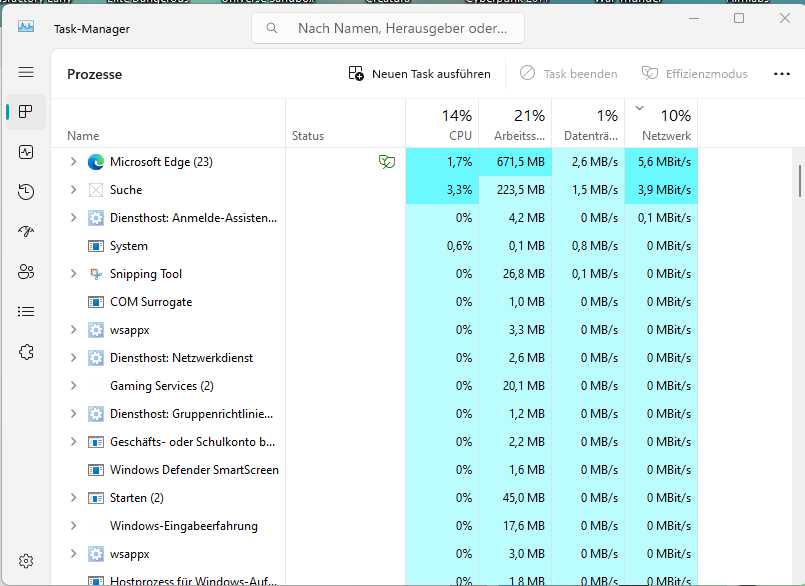
So, I'm broadly looking for a kind of "task manager" like in Windows.
stacer looked ok, but it says it has been abandoned on the webpage.
You have to set it to running via the Startup Applications then reboot, or you can just type nice /usr/bin/conky -p 10 19 in Terminal.
Every time you make a change to /etc/conky/conky.conf, Conky will shut down and reload so you can see the changes. I'd suggest just copy-n-pasting my conky.conf above, getting familiar with the program, then stripping out anything you don't want from conky.conf.
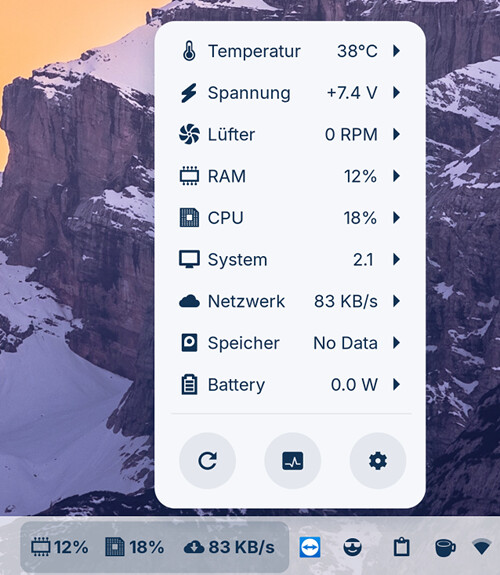
For quick at-a-glance monitoring, I recommend Vitals.
It is in the Software Channel of Zorin 17 (as indicated in the Unofficial Manual for Zorin 17 Core MkII I recently uploaded. ![]()
Ths used to be a gnome extension - is that still the case? Gnome seem to have taken over extension finds to be more difficult to use than the web page option that I used to use for Gnome extensions!
I always considered the web page option a little convoluted—probably a matter of preference.
Vitals is a Gnome extension, yes. I installed it via the Gnome Extension Manager, and it works like a charm. ![]()
Thanks for your help so far, but the programs aren't really what I'm looking for.
I'm looking for more of a "task manager" for Linux.
For example, I can sort my running programs/processes according to how much internet they use.
Stacer is closest I can find. Be careful of the cleaning options. I had forgotten about it until this post. Stacer download | SourceForge.net
Includes processes , services and so on.
The only rough unixoid equivalent that comes to mind is btop++.
Unfortunately, it does not allow sorting processes by their network usage. ![]()
Ok, thanks anyway for the help.
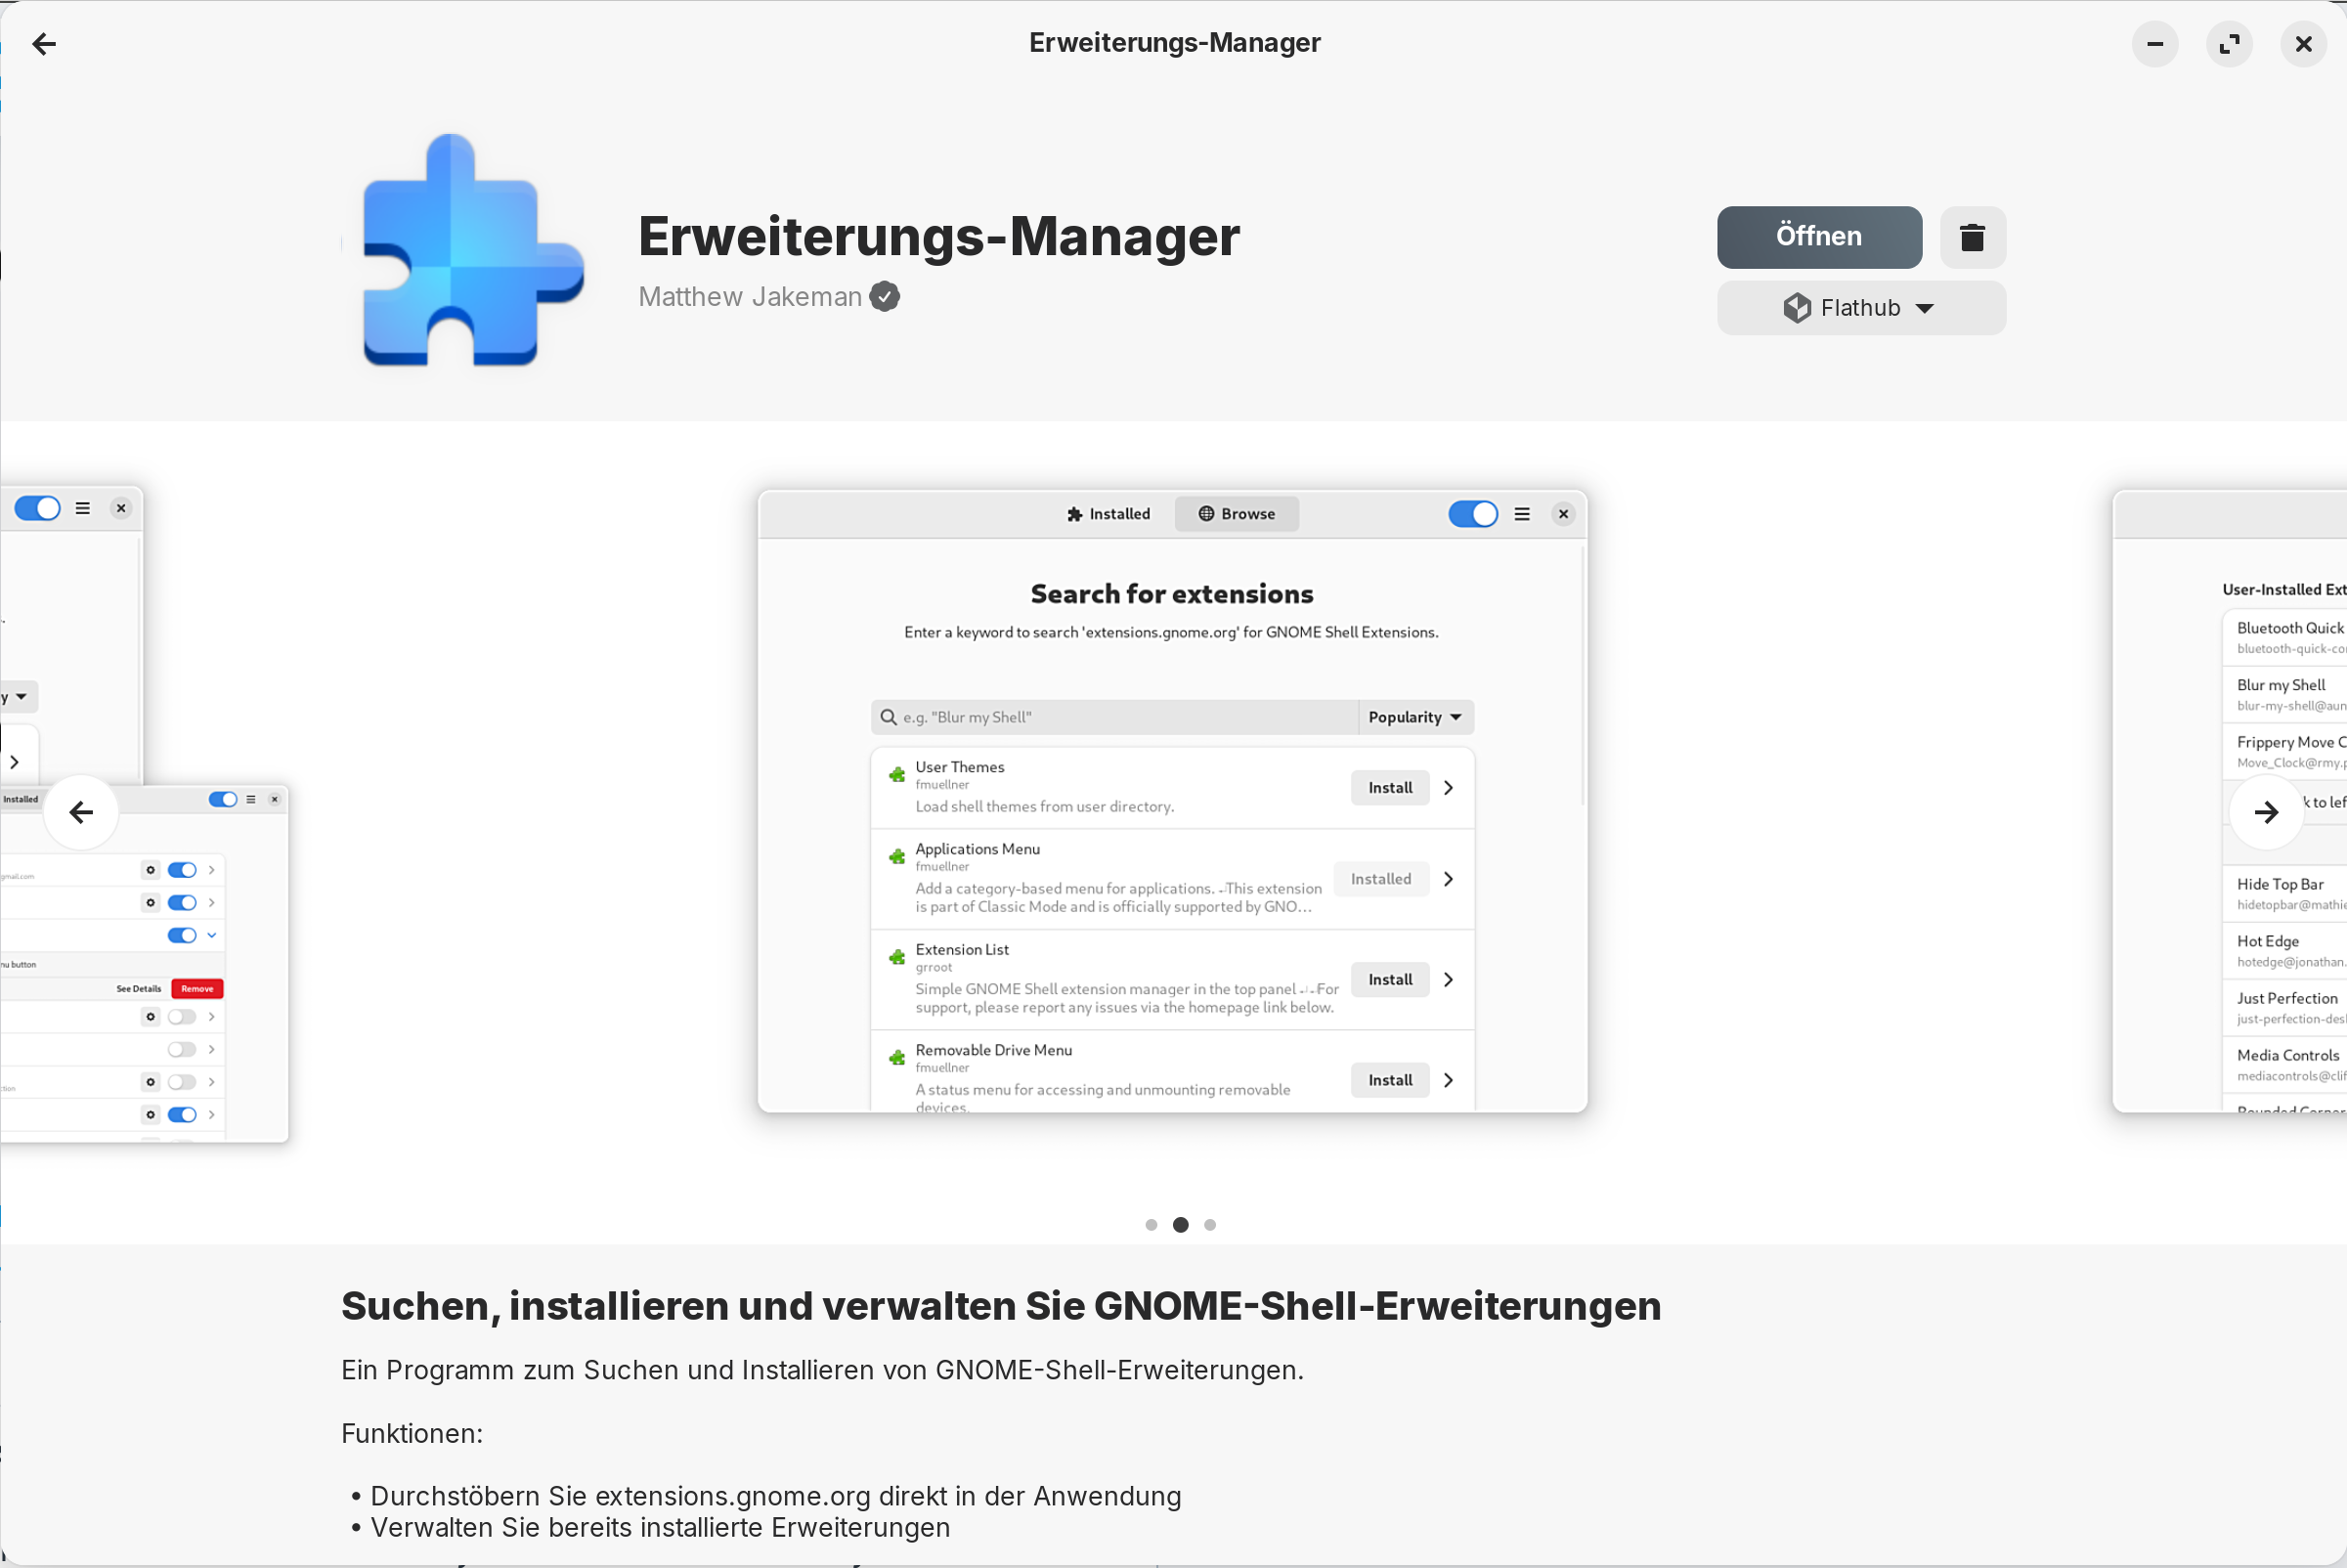
I had Problems with the Web Page too. But now i use like Ragnir the Extension Manager from Matthew Jakeman. It is like the Gnome Extension Manager but you can download over the ''Browse'' Menu directly Gnome Extensions so you don't need a Browser with the gnome Browser extension. Here a Screenschot:
Yes, I seem to remember proposing that in either the manual I produced for 15, or possibly Zorin 12. Been a while! ![]()
Yes, I know, it is just the layout of the Extension Manager is not as user friendly in terms of searching for extensions. If you don't know what you are looking for the results that come back tend to be garbage. The web version was a lot easier to Navigate, and also in Tweaks it was just a case of switching on or off.